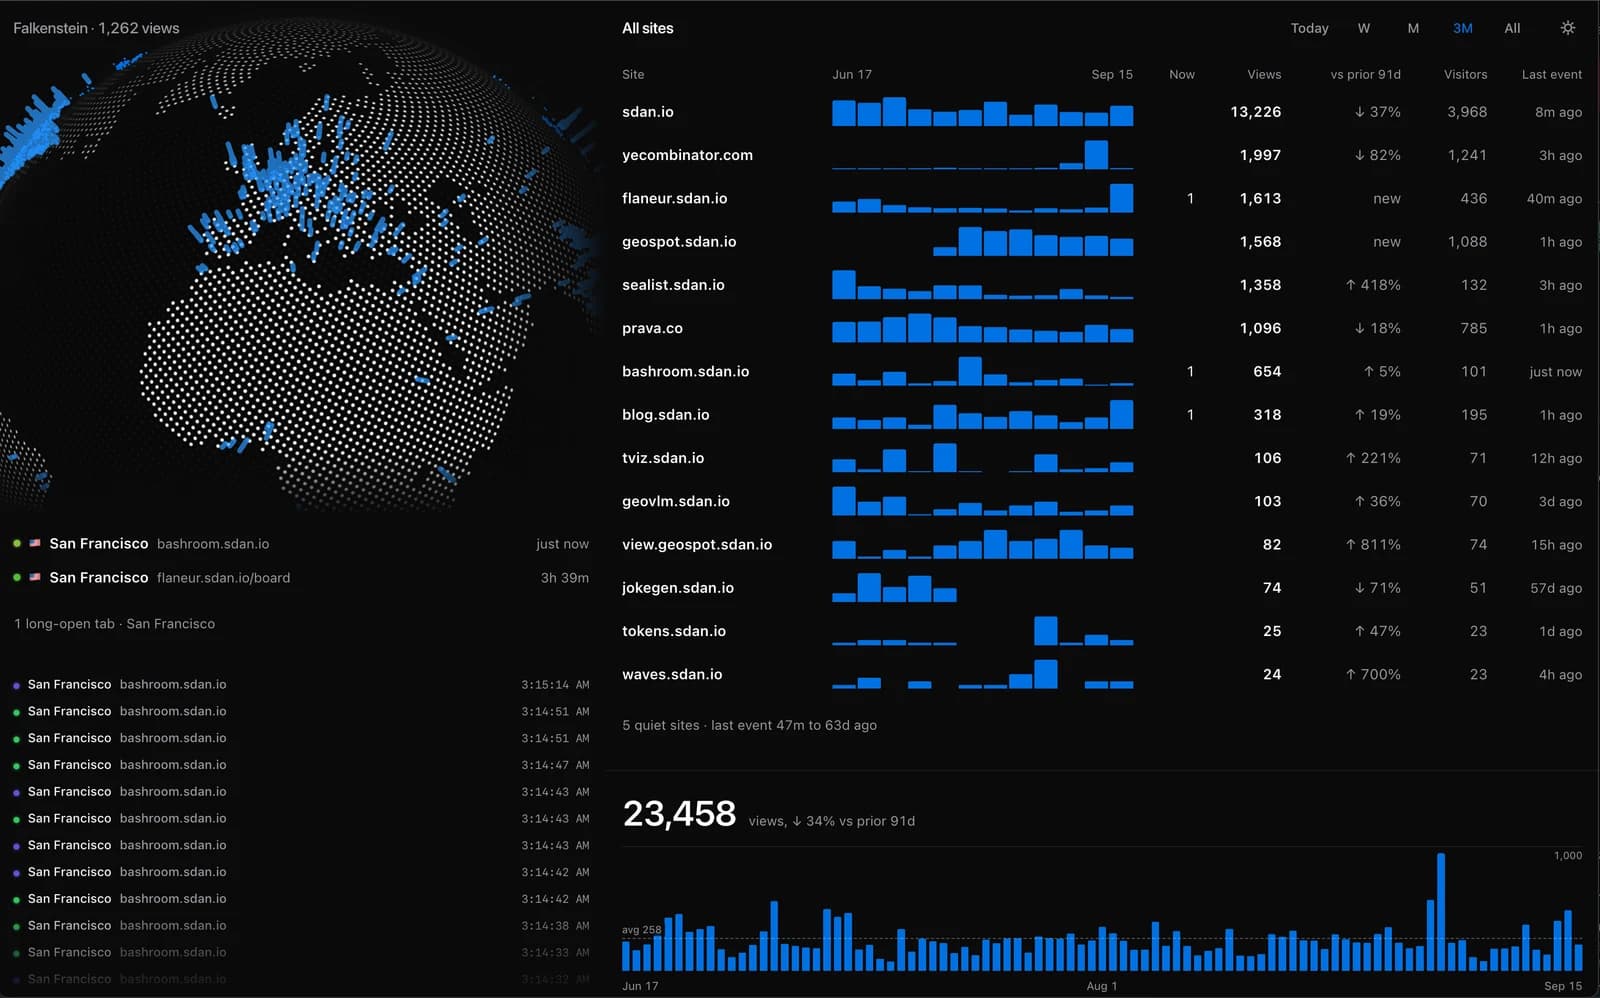
Pingpong is a realtime analytics engine for sites I run. Cloudflare Durable Objects employs an actor-architecture perfect for this since: every site opens up a websocket to each site's DO we can handle multiple tabs, live precise, and a DB directly in each worker. Due to the nature of DOs we need to have a "parent" DO that rolls all this up to serve into this dashboard which is what you see.
The design was initially based around a big sidebar and the globe. Overtime what I found make sense is to delete as much horizontal lines as possible and try to make every site interpretable on first glance. Keyboard shortcuts enhance this experience making it easy to go into and out of a website's analytics.
Profiling with Astra
I used Astra while profiling the dashboard in Chrome. The useful loop was concrete: reproduce an interaction, record it, inspect the expensive work, make a small change, then record the same interaction again.
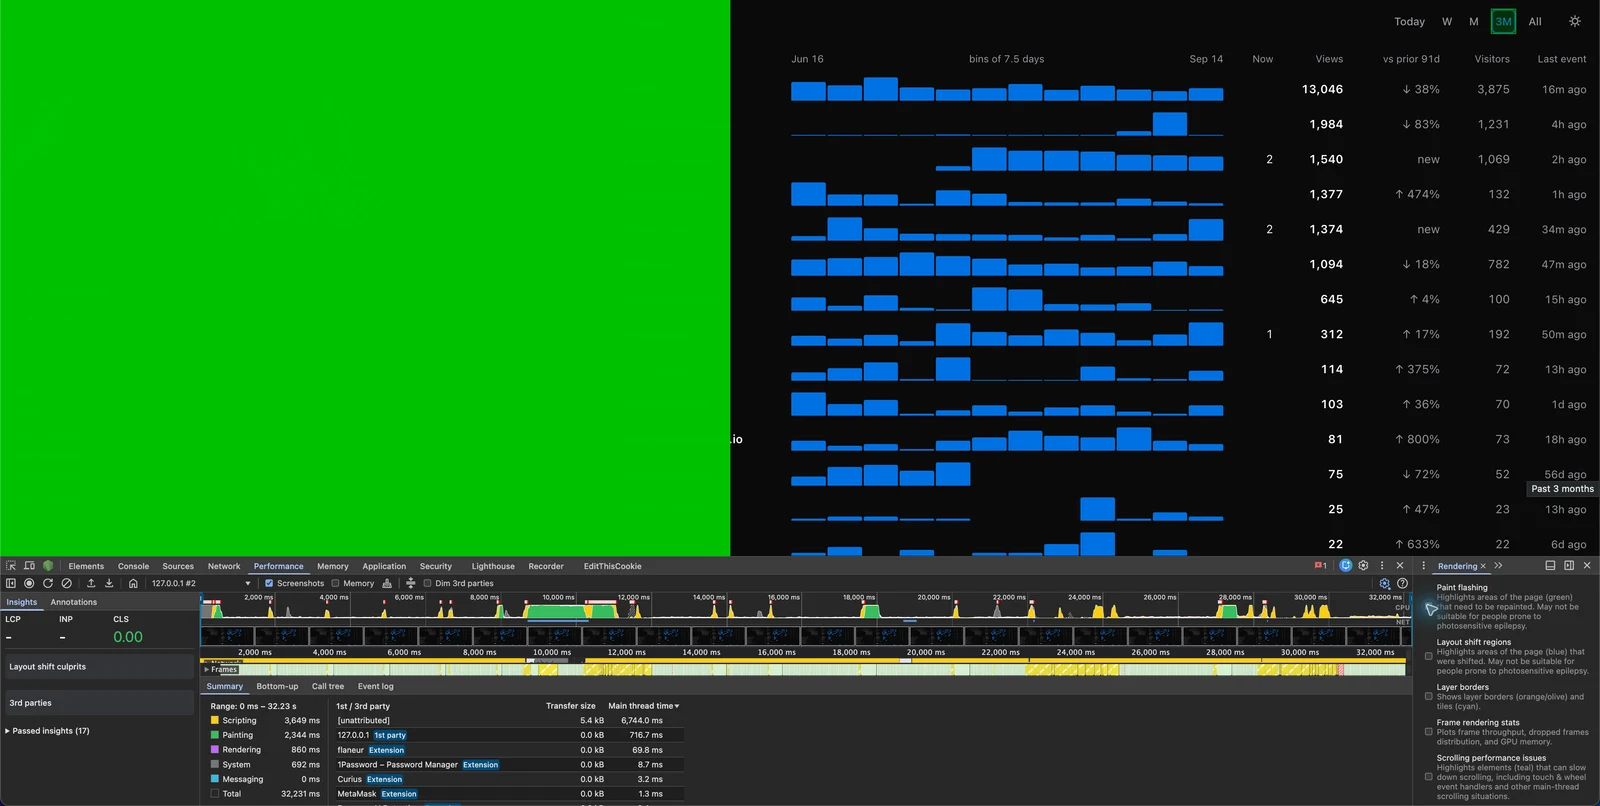
Paint flashing made the globe's redraw area hard to miss. The Performance panel put scripting, rendering, and painting on a timeline beside the frames. A smooth-looking screenshot alone couldn't tell me where the work was going.
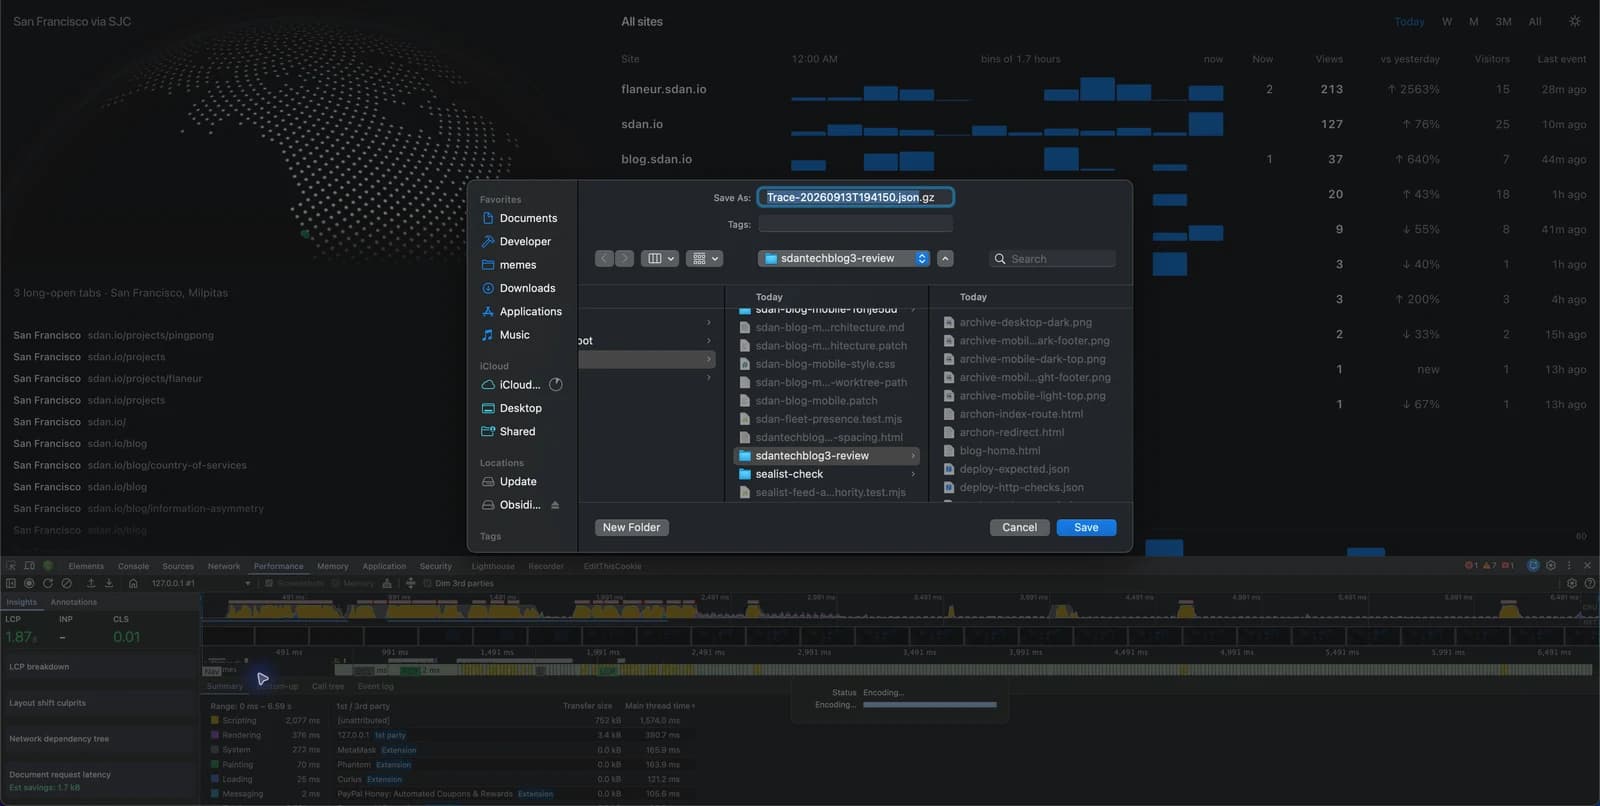
Saving the trace kept the investigation attached to an actual recording. These September 13 captures document the profiling process; they're not a before-and-after benchmark.
Underneath
One Cloudflare Worker serves the dashboard. D1 stores events and history; two Durable Objects coordinate live connections. Collection is idempotent, so retrying a page-view request doesn't count another visit. Historical queries and live presence have separate lifetimes, which keeps an old traffic snapshot from pretending someone is still here.